Regenerationen im Ranking
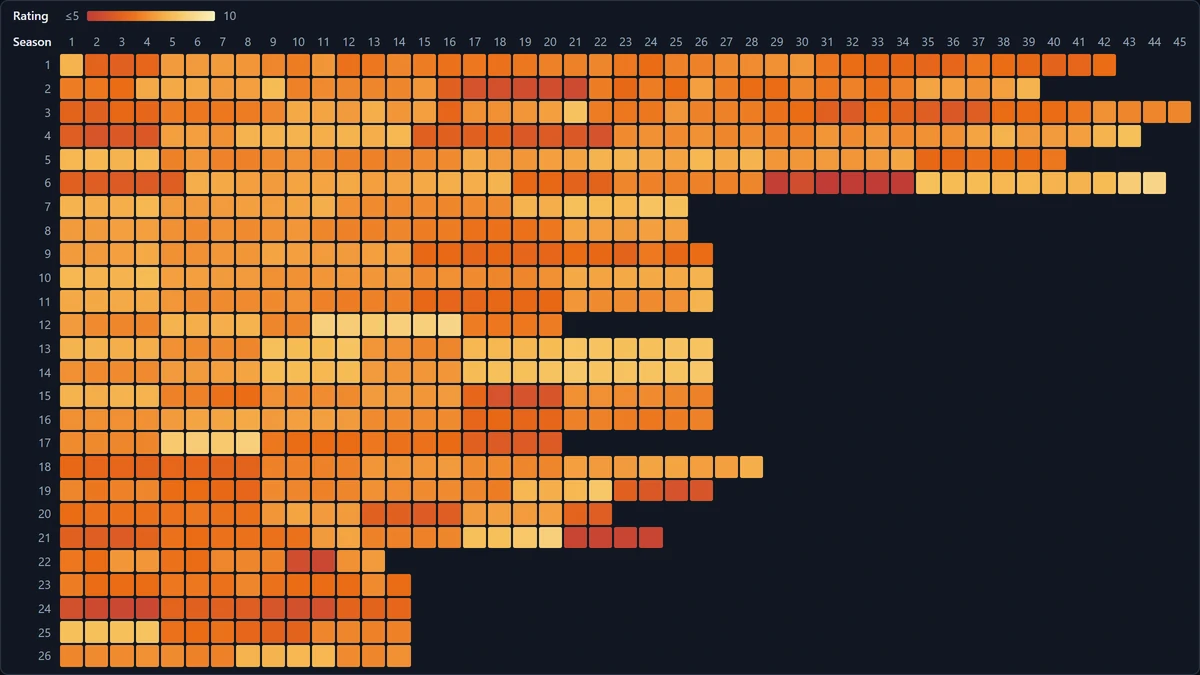
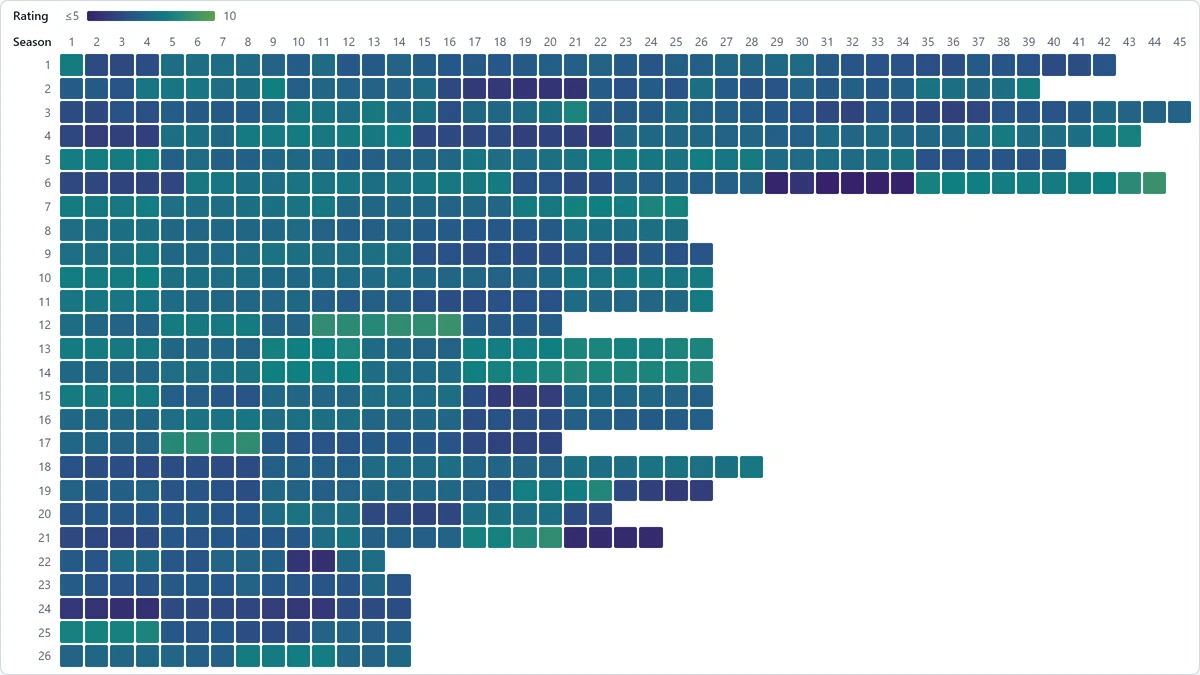
Alle regulären Doctor-Who-Folgen seit 1963 mit ihren IMDb-Bewertungen.
Projektbeschreibung und Demo gibt es bisher nur auf Englisch.
Who is the best Doctor?
Doctor Who has been running, off and on, since 1963. Every regeneration of the Doctor has nerdy fans who will swear that theirs is the best. Perhaps unsurprisingly, I have decided to settle it with mathematics and statistics.
The demo shows the rating of every regular episode on a timeline and in a season-by-episode heatmap. It also ranks the Doctors, writers and directors on a leaderboard.
The short answer: no matter how you count, David Tennant comes out as the best Doctor, and Steven Moffat as the best writer. Most of the other positions depend on how you define your rating.
Where does the data come from?
Ratings and vote counts come from IMDb’s non-commercial datasets, as of 18 November 2026.
Everything else comes from Wikipedia’s lists of Doctor Who episodes for the classic and revived series: which episodes make up each story, when they aired, and who wrote and directed them.
In total this is 863 episodes in 291 stories. Only regular episodes are included. Specials, as Wikipedia lists them, are left out: the Christmas and New Year episodes, the anniversary specials and the 1996 TV film. That leaves out the Eighth, War and Fourteenth Doctors, so 13 Doctors remain.
Caveats.
- The ratings are IMDb’s, from whoever chose to rate each episode. Classic episodes have far fewer votes: a median of 587 per episode, against 8,101 for revived ones.
- The data is a snapshot from 18 November 2026, so the numbers may change a little over time.
- Specials are left out, so stories like The Day of the Doctor don’t count towards anyone’s score.
Why count stories, not episodes?
The classic series told its stories as serials, most of them four or six episodes long, while the revived series mostly tells a story in one episode, sometimes two. Counting episodes would weight each classic Doctor by how long their serials were. So the unit here is the story, as Wikipedia numbers it. A story’s rating is the mean of its episodes’ ratings, and its weight is the mean number of votes per episode, so a six-part serial counts once, the same as a single episode.
How do you assign scores?
Each Doctor, writer or director gets a score from the ratings of their stories. The rating is determined by three factors:
The average. One of three different averages: mean of the story ratings, mean weighted by votes per episode, or the median.
Shrinkage. Christopher Eccleston has 10 stories, while Tom Baker has 41. This means that Christopher Eccleston’s average is less reliable than Tom Baker’s. Shrinkage accounts for this by giving everyone extra episodes, all rated at the global average. This pulls everyone’s ratings closer to the average, but has a bigger effect on Christopher Eccleston than Tom Baker. The result is that a handful of great episodes isn’t enough on its own. A high score needs a high average across many episodes.
More concretely, with k extra episodes at the global average m, a Doctor that averages x̄ over n episodes gets a score of:
score = (k·m + n·x̄) / (k + n)
The value k is a judgement call, which is why it’s a slider on the demo.
Era adjustment. The two eras don’t rate the same on IMDb: the new era stories average 7.65, and the classic ones average 7.29 (vote-weighted). Comparing episodes across eras therefore gives a head start to the new era stories. The era adjustment removes it by scoring each episode against the average for its own era. A classic episode rated 7.8 scores +0.5, because it beats the classic average by half a point. A revived episode with the same 7.8 scores only +0.15. Scores then read as points above or below a typical episode of the same era.
Writers and directors need at least three stories to be ranked, and a co-written story counts in full for each writer.
The defaults are the vote-weighted mean, k = 5 and no era adjustment.
Does the answer depend on how you count?
I ranked everyone under every combination of the controls: three averages, shrinkage from 0 to 20, and era adjustment on or off. This gives 3 x 21 x 2 = 126 combinations.
Under all combinations, David Tennant comes out as the best Doctor, and Jodie Whittaker as the worst. Among the writers, Steven Moffat is first in all 126.
Most of the other positions depend on how you define the rating: Tom Baker ranges from 2nd to 7th, Christopher Eccleston from 3rd to 7th, Peter Capaldi from 2nd to 6th, and Matt Smith from 2nd to 4th.
How was this demo made?
The code is on GitHub. A Python pipeline joins IMDb’s datasets with Wikipedia’s tables, checks the result and computes the leaderboard’s rankings. The demo computes them again in JavaScript, and its tests check that the two agree exactly. The charts are drawn by hand in SVG and HTML.
Agentic coding: I built the demo with Claude Code, Anthropic’s coding agent, in stages.
- Research. The agent went through my original notebook from 2025, step by step.
- A plan, in which I settled the design questions, such as counting stories instead of episodes, where the writer and director credits come from, and which assumptions the leaderboard lets you change.
- The data: the Python pipeline and its tests, which check each season’s episode count against Wikipedia, and that the stories at each regeneration go to the right Doctor.
- The interface: the timeline and the heatmap, then the leaderboard, whose JavaScript rankings are tested against the Python ones.
- Polish, from my notes on the live demo: brighter heatmap colours, fewer controls, a better search, and hover boxes that no longer hide the timeline. For the colours, the agent rendered options on the real demo, and I chose between them.
Information courtesy of IMDb (https://www.imdb.com). Used with permission.
Wikipedia information under CC BY-SA 4.0.